
This analysis uses mathematical modeling to estimate the expected number of pulls required to obtain a 6★ character in the mobile game Arknights.
What is Arknights

Arknights is a tower defense mobile game where players lead operators to defend against threats in a dystopian world. The game uses a gacha system with the following key features:
- Operators are ranked by star ratings (1-6 stars)
- 6★ operators are the most powerful and rarest
- Base probability of obtaining a 6★ operator: 2%
- A pity system increases odds after 50 unsuccessful pulls
Pity System:
After 50 pulls without a 6★, probability increases from 2% to 4%. It continues increasing by 2% per pull until reaching 100%, guaranteeing a 6★ operator.
The Problem
While we know the probability distribution, players need to understand the expected number of pulls required to obtain a 6★ operator. This information helps players plan Orundum (gacha currency) accumulation for upcoming event banners.
Previous approaches includes Monte Carlo simulations and data analysis. This post develops a mathematical model using probability theory to solve the same problem.
Modeling the 1st to 50th Pull
For the first 50 pulls, the probability remains constant at 2%. We can model this using the binomial distribution, which requires:
- A fixed number of rolls
- Independence between each roll
- Two possible outcomes (success or failure)
- Constant probability of success
The binomial distribution equation is:
$$ P_{x}=\left(\begin{array}{l}n \ x\end{array}\right) p^{x} q^{n-x} $$
Since we want the probability of obtaining exactly one 6★ on the nth pull (not within n pulls), we need to adjust the equation. We’re looking for the probability of success on exactly the nth pull, given all previous pulls failed:
$$ P(n)=0.02 \times 0.98^{n-1}, \quad 1 \leq n \leq 50 $$
Modeling the 51st to 99th Pull
After the 50th pull, the success rate increases by 2% per pull:
- 51st pull: 4% success rate
- 52nd pull: 6% success rate
- And so on until 99th pull: 100% success rate
Since the probability is no longer fixed, we need a different approach. For each specific pull:
- For the 51st pull: $P(51)=0.04 \times 0.98^{50}$
- For the 52nd pull: $P(52)=0.06 \times 0.96 \times 0.98^{50}$
- For the 53rd pull: $P(53)=0.08 \times 0.94 \times 0.96 \times 0.98^{50}$
We can generalize this as:
$$ P(n)=0.02(n-49) \times 0.98^{50} \times \prod_{k=51}^{n-1}(1.98-0.02 k), \quad 50<n \leq 99 $$
Our complete model is therefore:
$$ P(n) = \begin{cases} 0.02 \times 0.98^{n-1}, & 1 \leq n \leq 50 \\ 0.02 \times (n-49) \times 0.98^{50} \times \prod_{k=51}^{n-1}(1.98-0.02k), & 50 < n \leq 99 \end{cases} $$
Graphical Analysis
When graphed, our model shows:
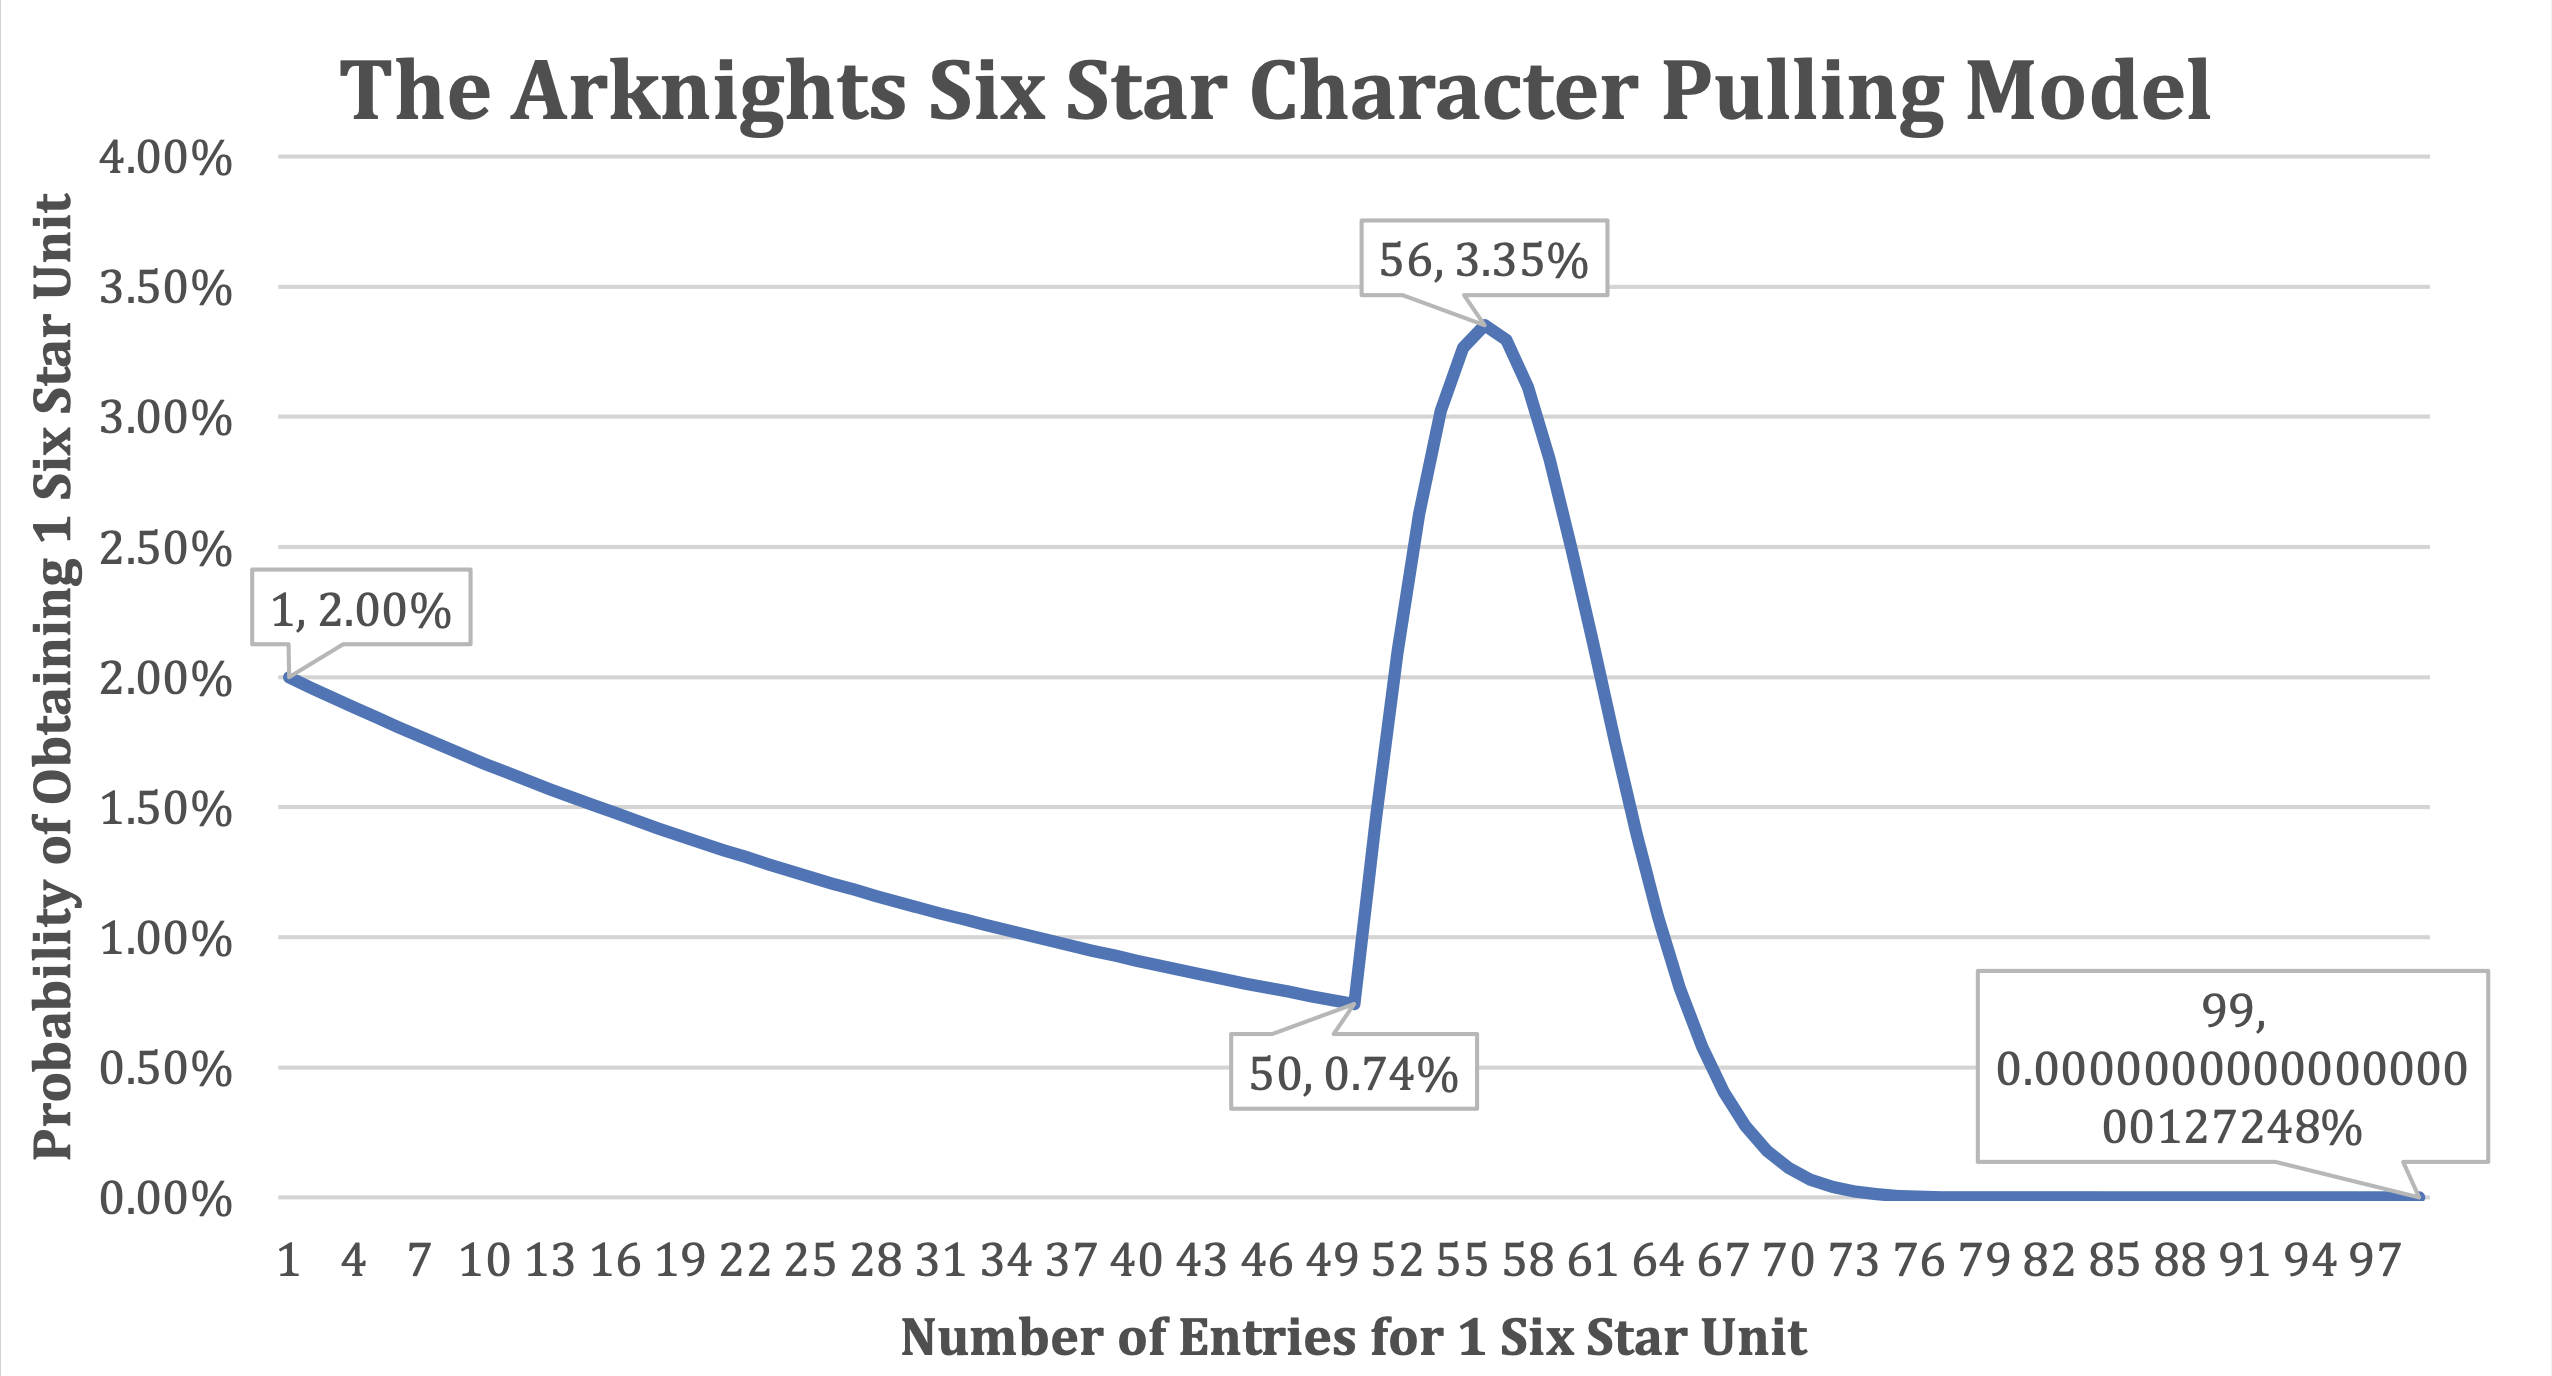
Key observations:
- Initial probability is 2%
- Probability gradually decreases until the 50th pull (0.74%)
- At the 51st pull, the pity system activates, creating an upward slope
- Peak probability occurs at the 56th pull (3.35%)
- You have a higher chance of being struck by lightning (~$2 × 10^{-4}$%) than reaching the 99th pull without obtaining a 6★ Operator (~$1.27 × 10^{-19}$%).
Solution 1: Cumulative Probability
The cumulative probability represents the chance of obtaining a 6★ by the nth pull:
$$ \text{Cumulative Probability} = \sum_{i=1}^{n} P(i), \quad 1 \leq n \leq 99 $$
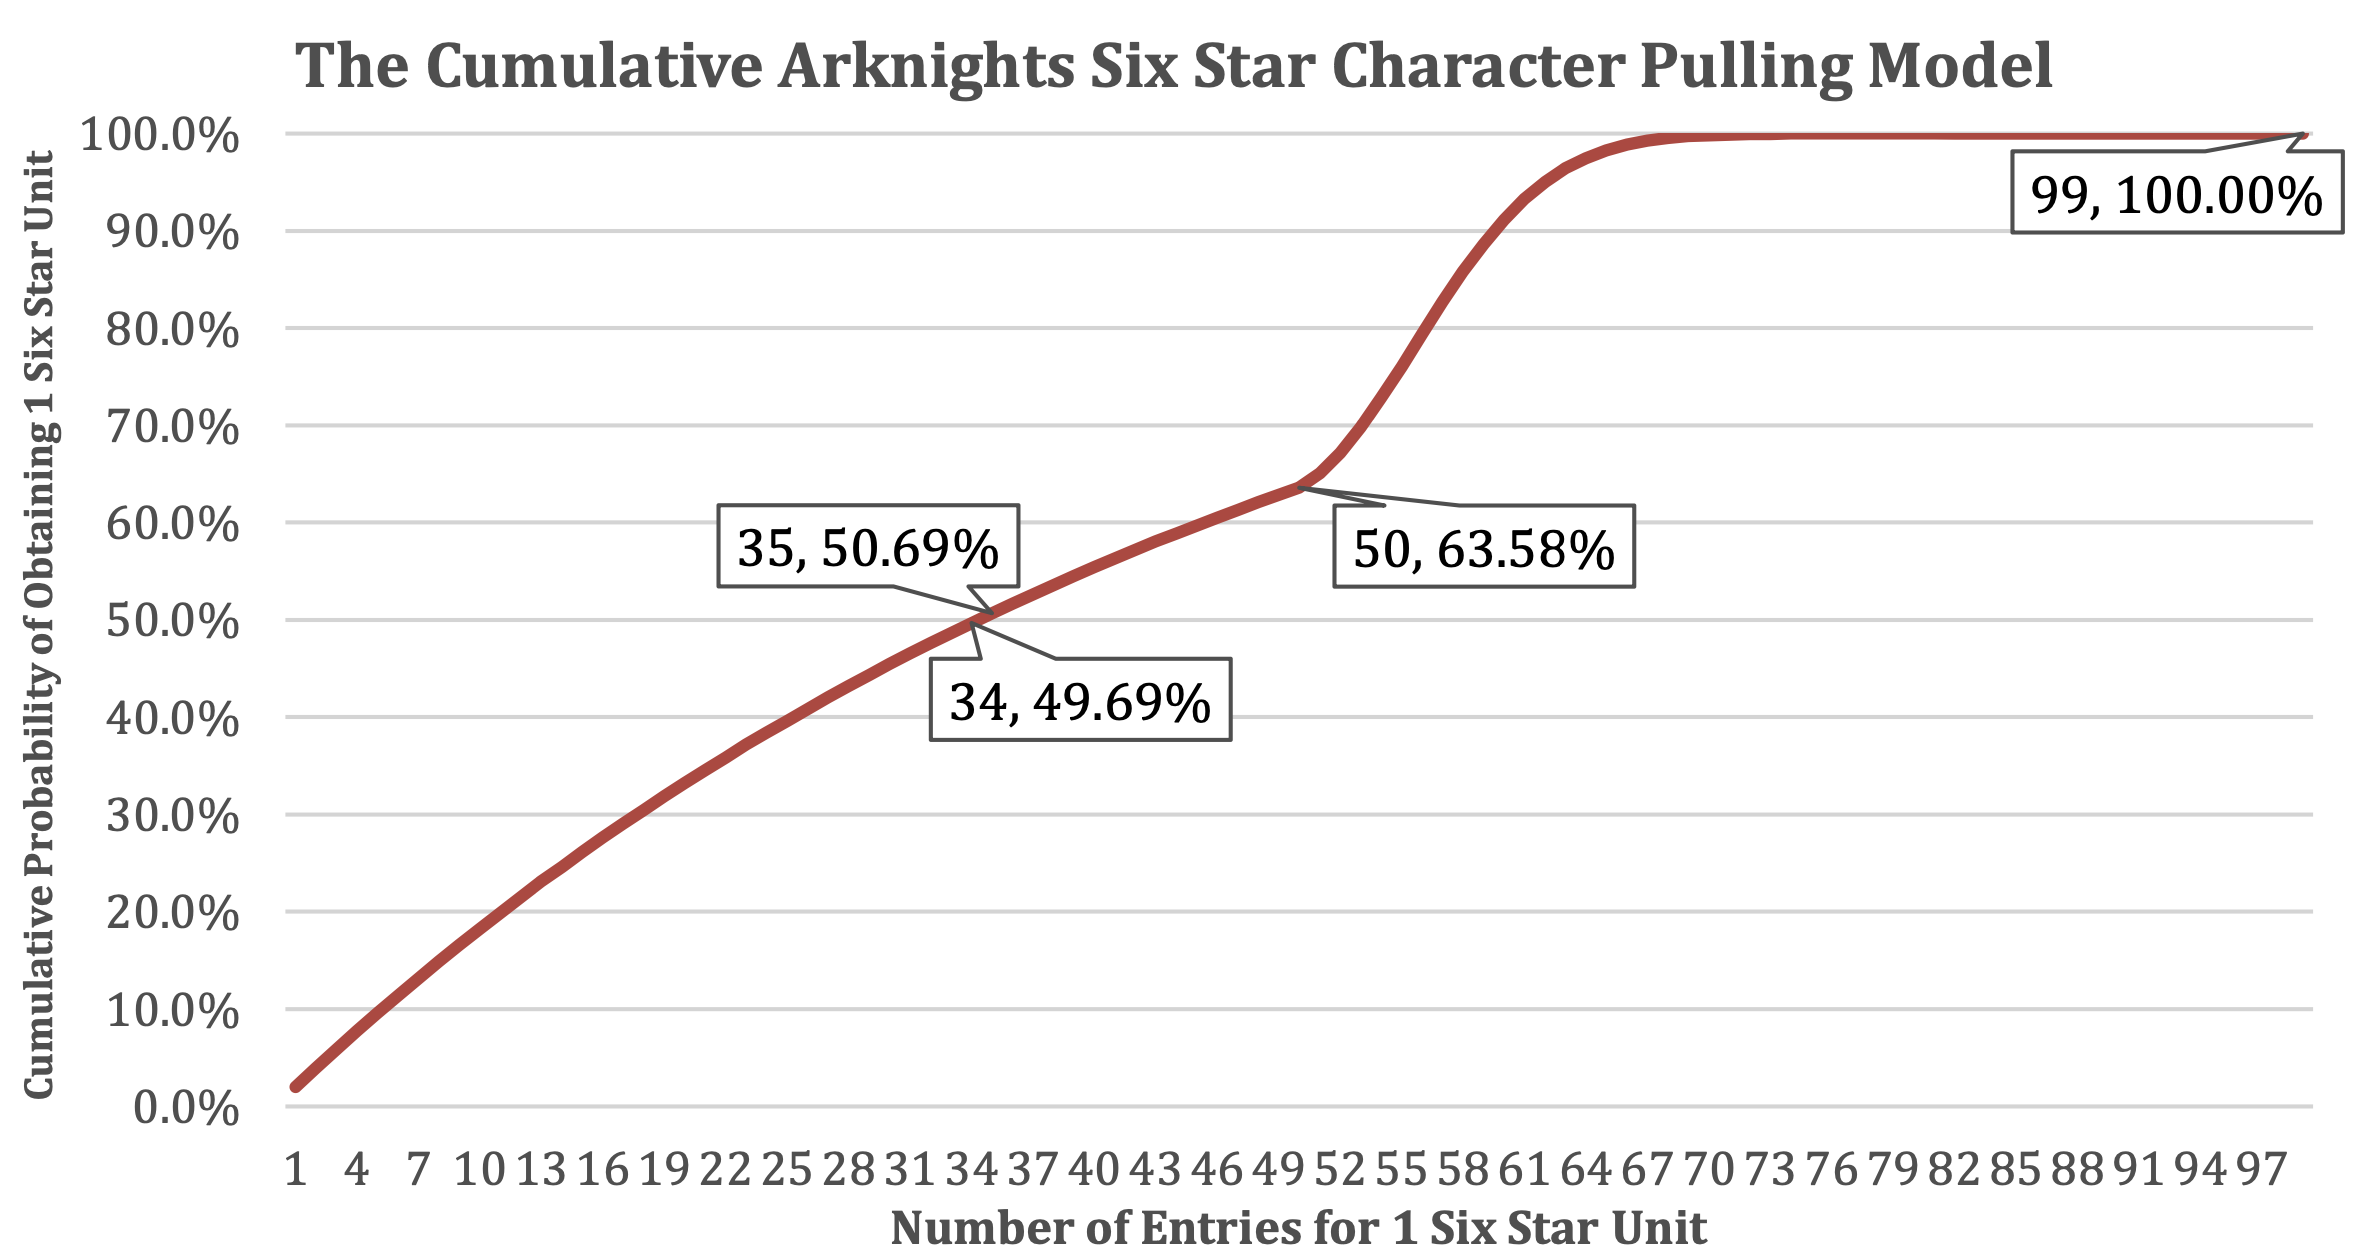
At the 35th pull, the cumulative probability reaches 50.69%, meaning half of all players will have obtained a 6★ by this point.
Solution 2: Expected Value Calculation
The expected value represents the average number of pulls required:
$$ E(\text{Pulling 1 Six Star}) = \sum_{i=1}^{99}(i \times P(i)) $$
Solving this equation:
$$ E(\text{Pulling 1 Six Star}) = 34.59 $$
Conclusion
Both solutions converge on approximately 34.59 pulls as the expected number required to obtain a 6★ operator. This aligns with other methodologies including Monte Carlo simulations.
Practical implications:
- Average cost: 600 Orundum × 35 pulls = 21,000 Orundum
- Players can use the quantile table below to assess their "luck"
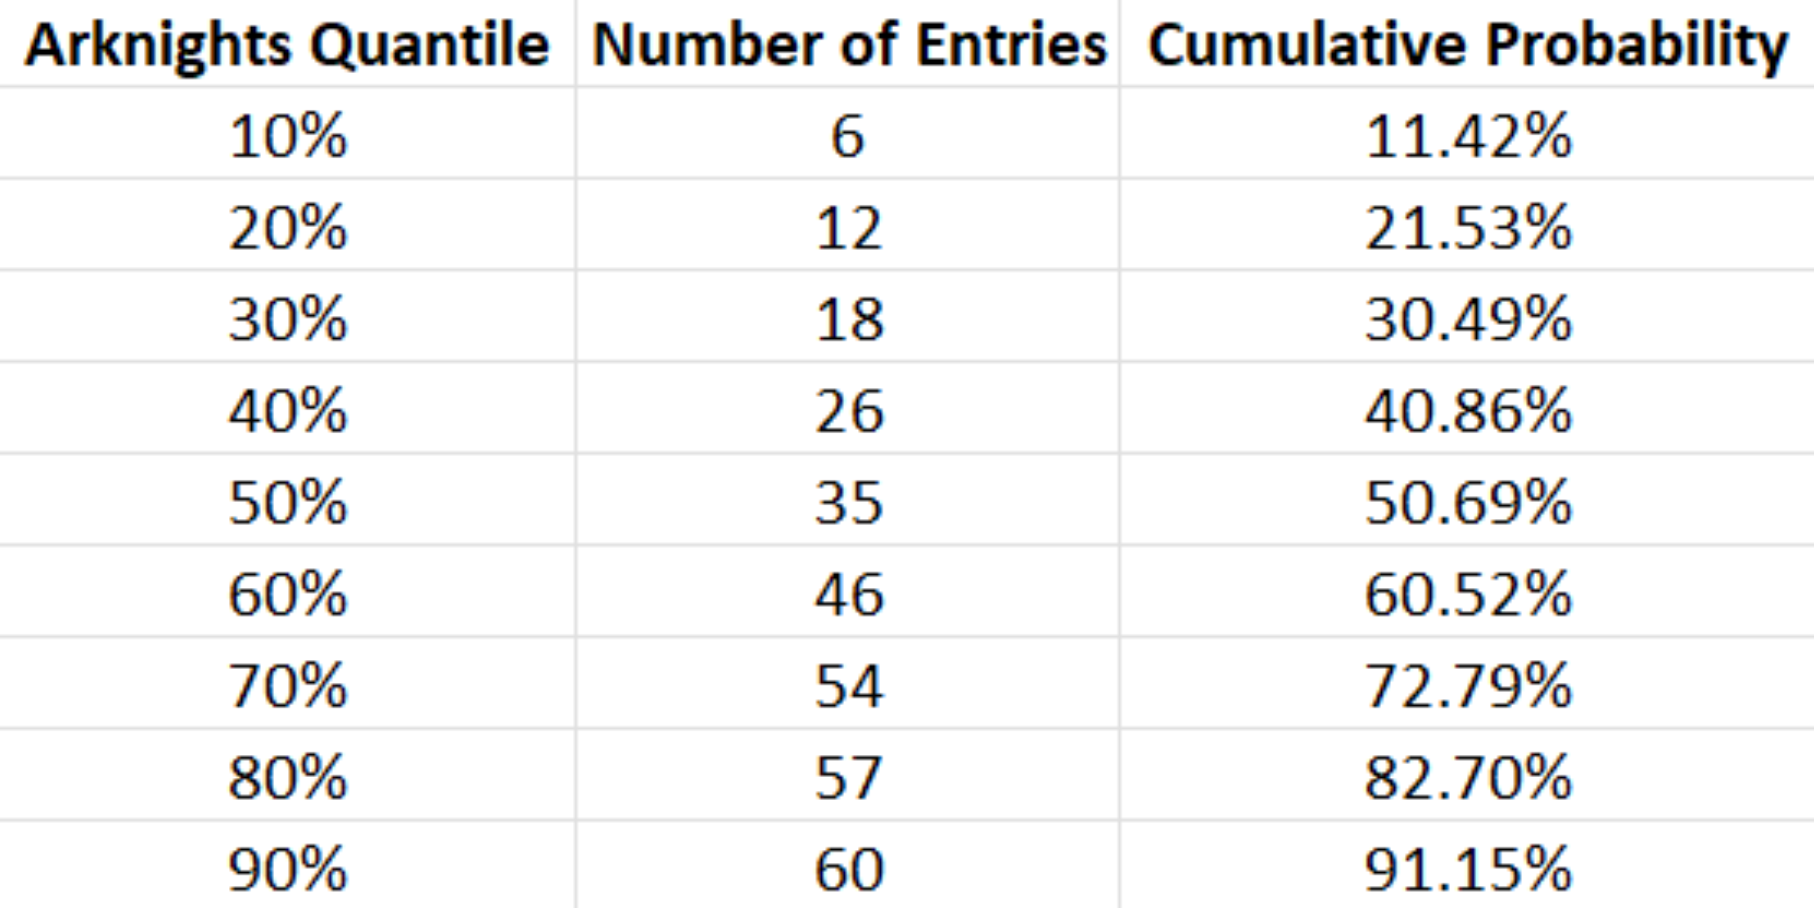
For example, obtaining a 6★ in 26 pulls places you in the top 40.86% of players, meaning you’re luckier than approximately 60% of the player base.
Future Directions
This analysis could be extended by:
- Incorporating Markov processes to model the dependence between successive pulls
- Calculating the probability of obtaining a specific 6★ operator
- Analyzing the economic aspects of Orundum distribution among players
This mathematical approach offers players concrete insights into resource planning for Arknights, helping them determine how much currency they need to save for upcoming banners.